
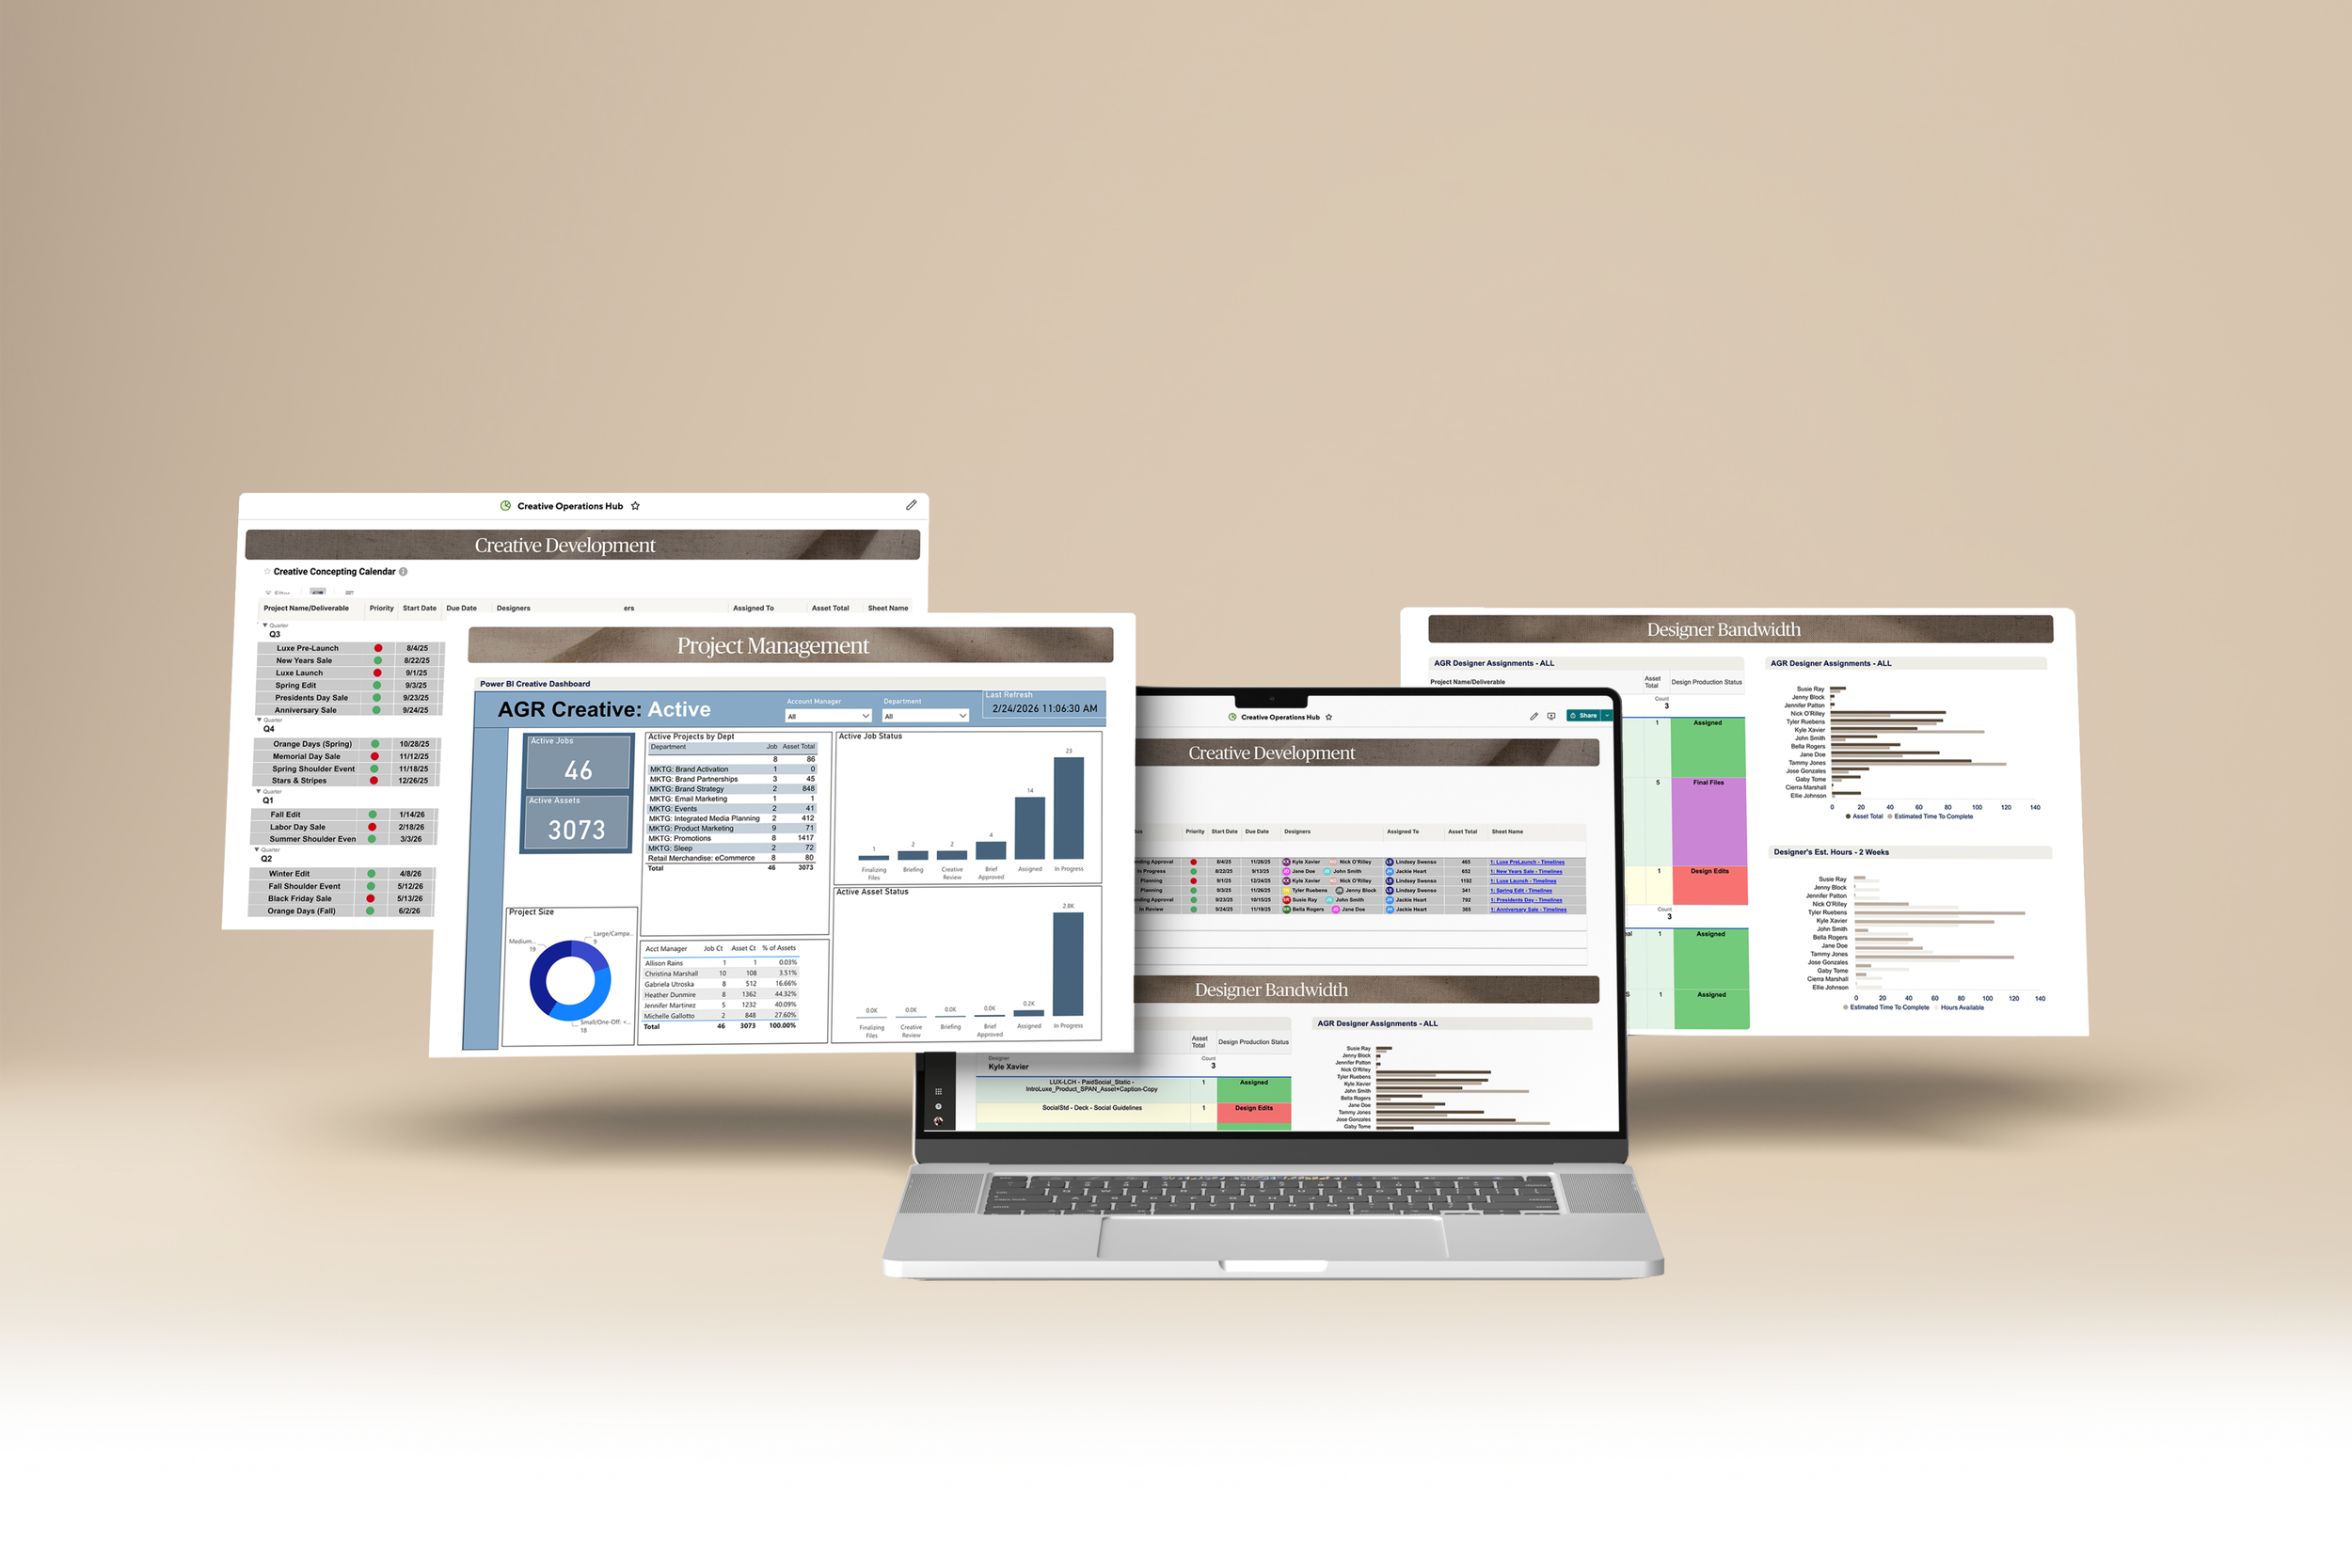
Creative Operations Visibility Dashboard
Developed a more connected view of how work moved from early creative direction stages to active resource allocation and campaign demand over time. By consolidating these data points, the dashboard supported clearer cross-functional planning.

The Opportunity
As creative demand increased across teams and channels, there was a growing need for better visibility into both upcoming initiatives and current team capacity.
Creative, marketing, and business partners needed a clearer way to understand:
When creative direction support would be needed
How team bandwidth was being allocated across projects
How campaign demand was trending YTD and YoY
Which departments were driving creative requests
How asset volume was changing across campaigns
Without a centralized view, teams were often working from fragmented information, making it harder to forecast needs, plan effectively, and align resources against business priorities.

Creative Development Schedule
SOLUTION: This component connects to a Master Campaign Calendar and syncs with GTM milestones for each campaign in the pipeline. This builds a window of when the Design team would expect to engage in creative direction and production planning across all upcoming campaigns.
RESULT: These reports allowed the team to quantify staffing needs against the campaign throughput that was in the pipeline an allocate budgets to accommodate production schedules.

Resource Allocation & Designer Bandwidth
SOLUTION: This view tracked team capacity across the entire creative studio, including lead, production, and junior designers, as well as production, AI and CGI teams.
RESULT: Reporting helped clarify how resources were distributed across current projects and made it easier to identify overload risk, gaps in coverage, and opportunities to rebalance assignments.

Marketing Campaign Visibility Year Over Year
SOLUTION: This element provided a broader view of campaign activity and creative demand over time. It showed current asset totals by campaign, volume of creative requests YTD, and which departments were requesting and receiving campaign support.
RESULT: This helped connect creative output to broader business demand and gave teams a more strategic lens into how campaign volume, stakeholder needs, and delivery patterns were evolving.
Overall improvements include:
Resource allocation improved creative turn times by 40%.
Creative revisions were reduced by 24%.
Cross-functional visibility to volume of work reduced last-minute requests by 52%.
New creative team DAM restructure and implementation project
Redefined how design assets were stored, managed, and tracked by shaping a more intuitive DAM system and optimizing file organization and visibility.